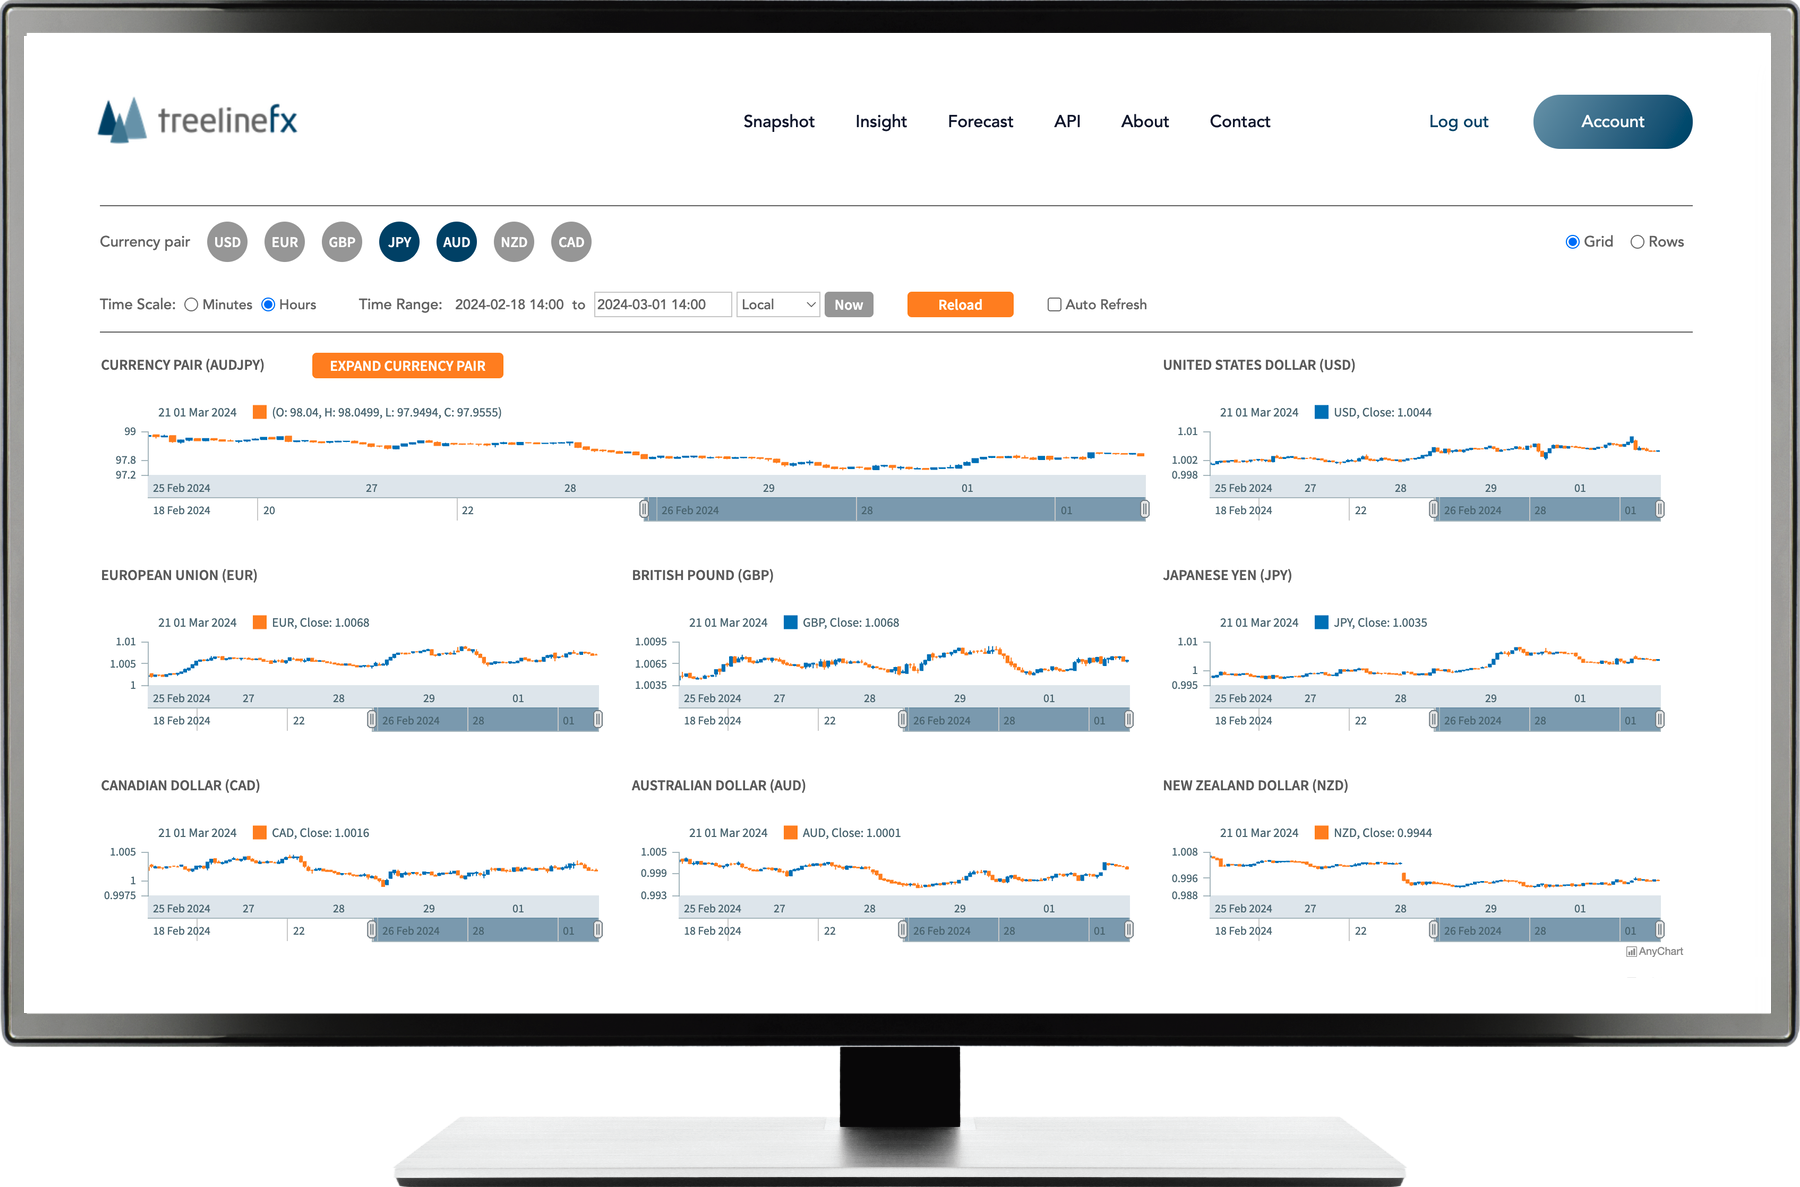
Full market snapshot
Assessing the Forex market can be confusing and difficult with so many crossing currency pairs. The TreelineFX Snapshot tool allows you to quickly take the market's temperature by showing the main currency indexes on one screen: EUR, USD, GBP, JPY, CAD, AUD and NZD. By quickly seeing where the market movements are occurring, traders can direct their attention where it's most needed.
CounterFlow Trend Indicator
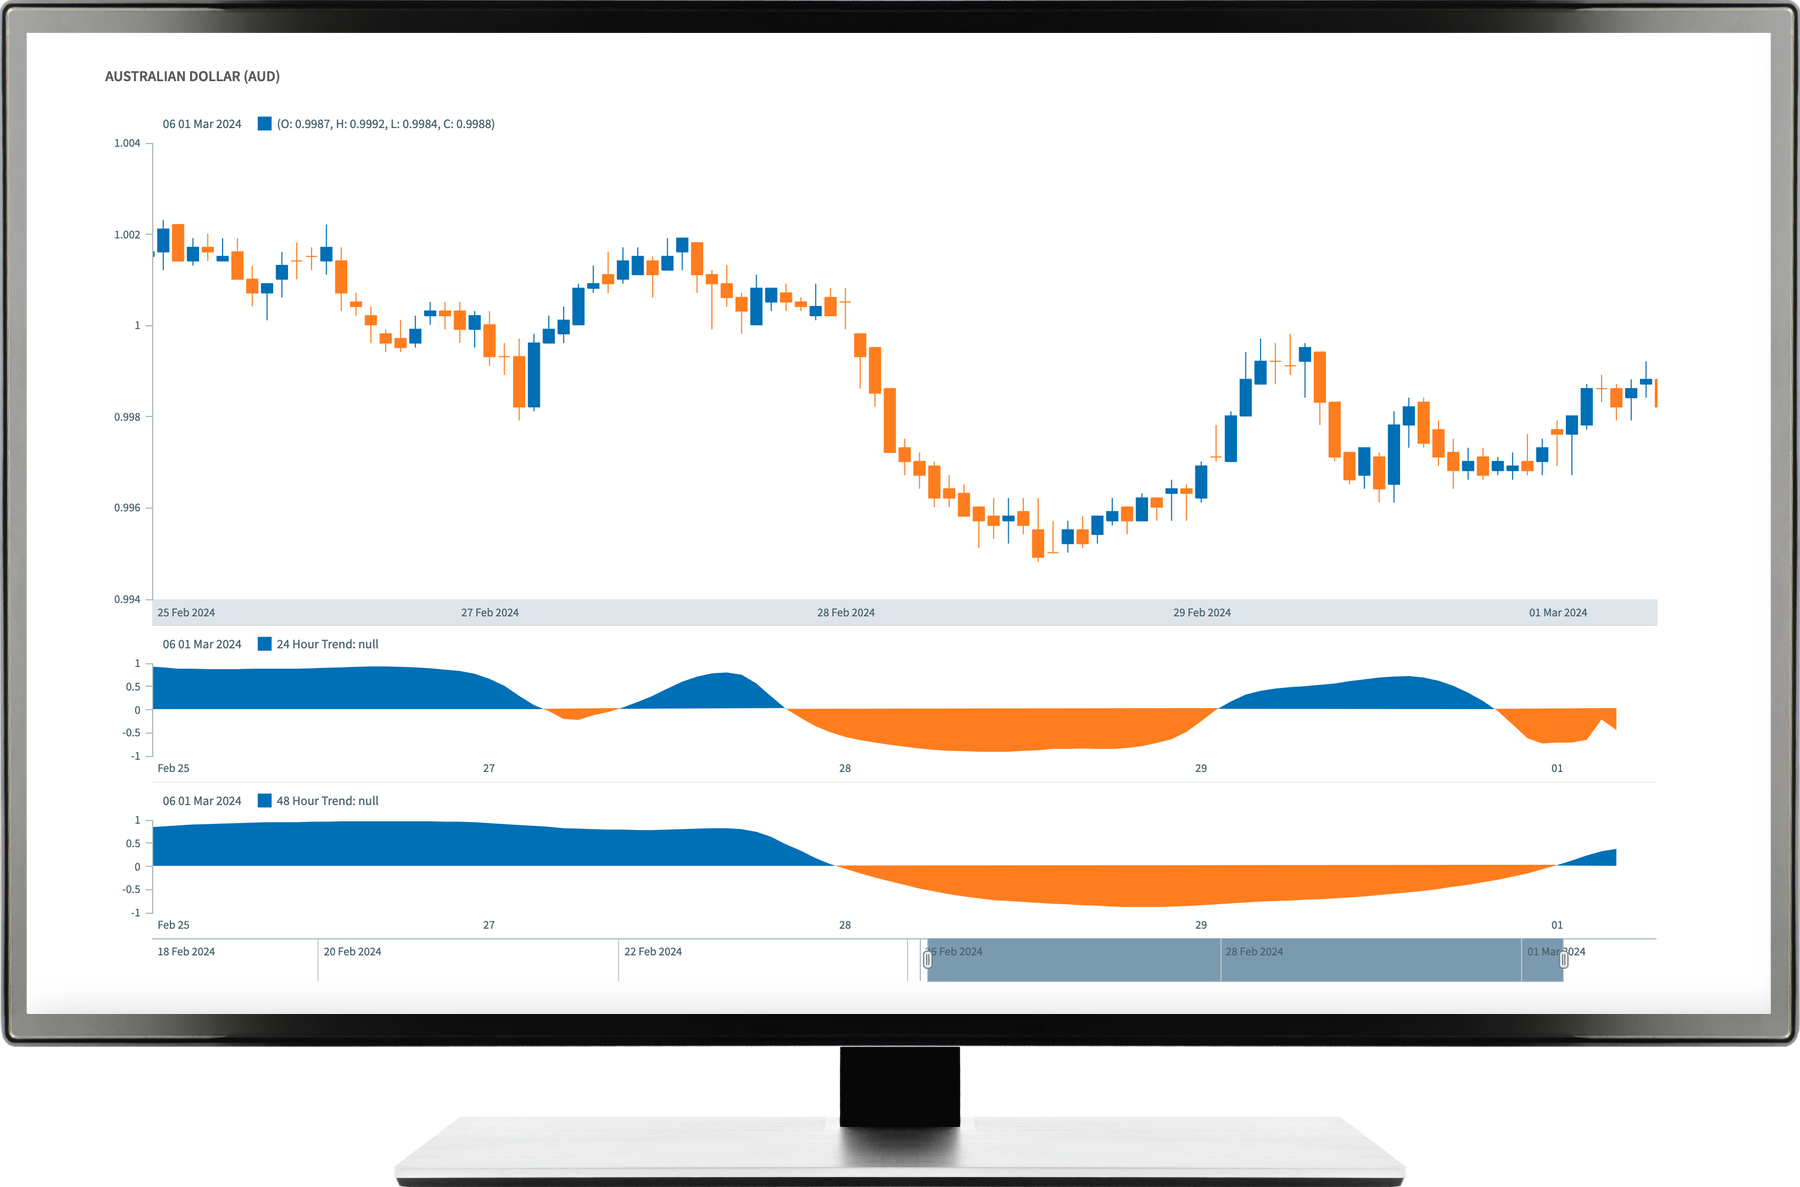
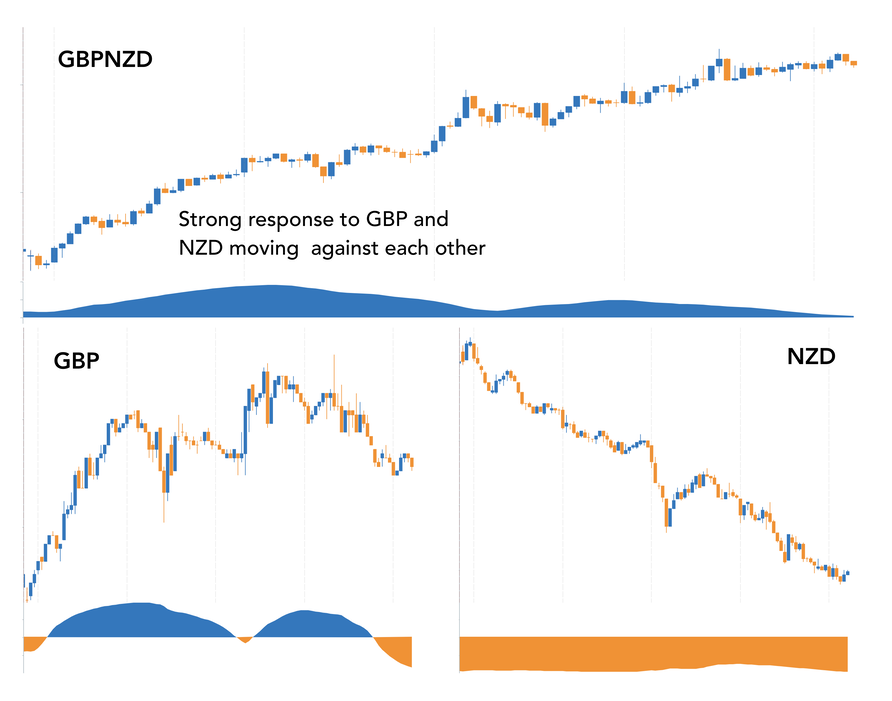
Our ConterFlow trend indicator provides you with three trend measures for a given currency pair. One for each of the underlying currencies in the pair, and one for the pair itself. This pair trend indicator is modulated according to the inverse correlation of the two underlying currencies. Inverse, because the two currencies should work against each other to produce significant movements in the pair.
In this example, we see the EURUSD pair has a big movement to the long side, but the pair trend indicator is fairly weak. Let's look at the underlying currencies to see why. Our underlying indexes EUR and USD have asssigned this big movement to the USD. At the indicated point in time, the EUR index is starting to fall to the short side. With both EUR and USD moving in the short direction, the EURUSD might be losing steam as they are not inversely correlated. Our EURUSD trend measure is fairly weak as a result, indicating a potentially choppy market ahead. An analyst can use this information to look for an alternative pair against USD, where the indicator gives a stronger sigal.
Forecasting
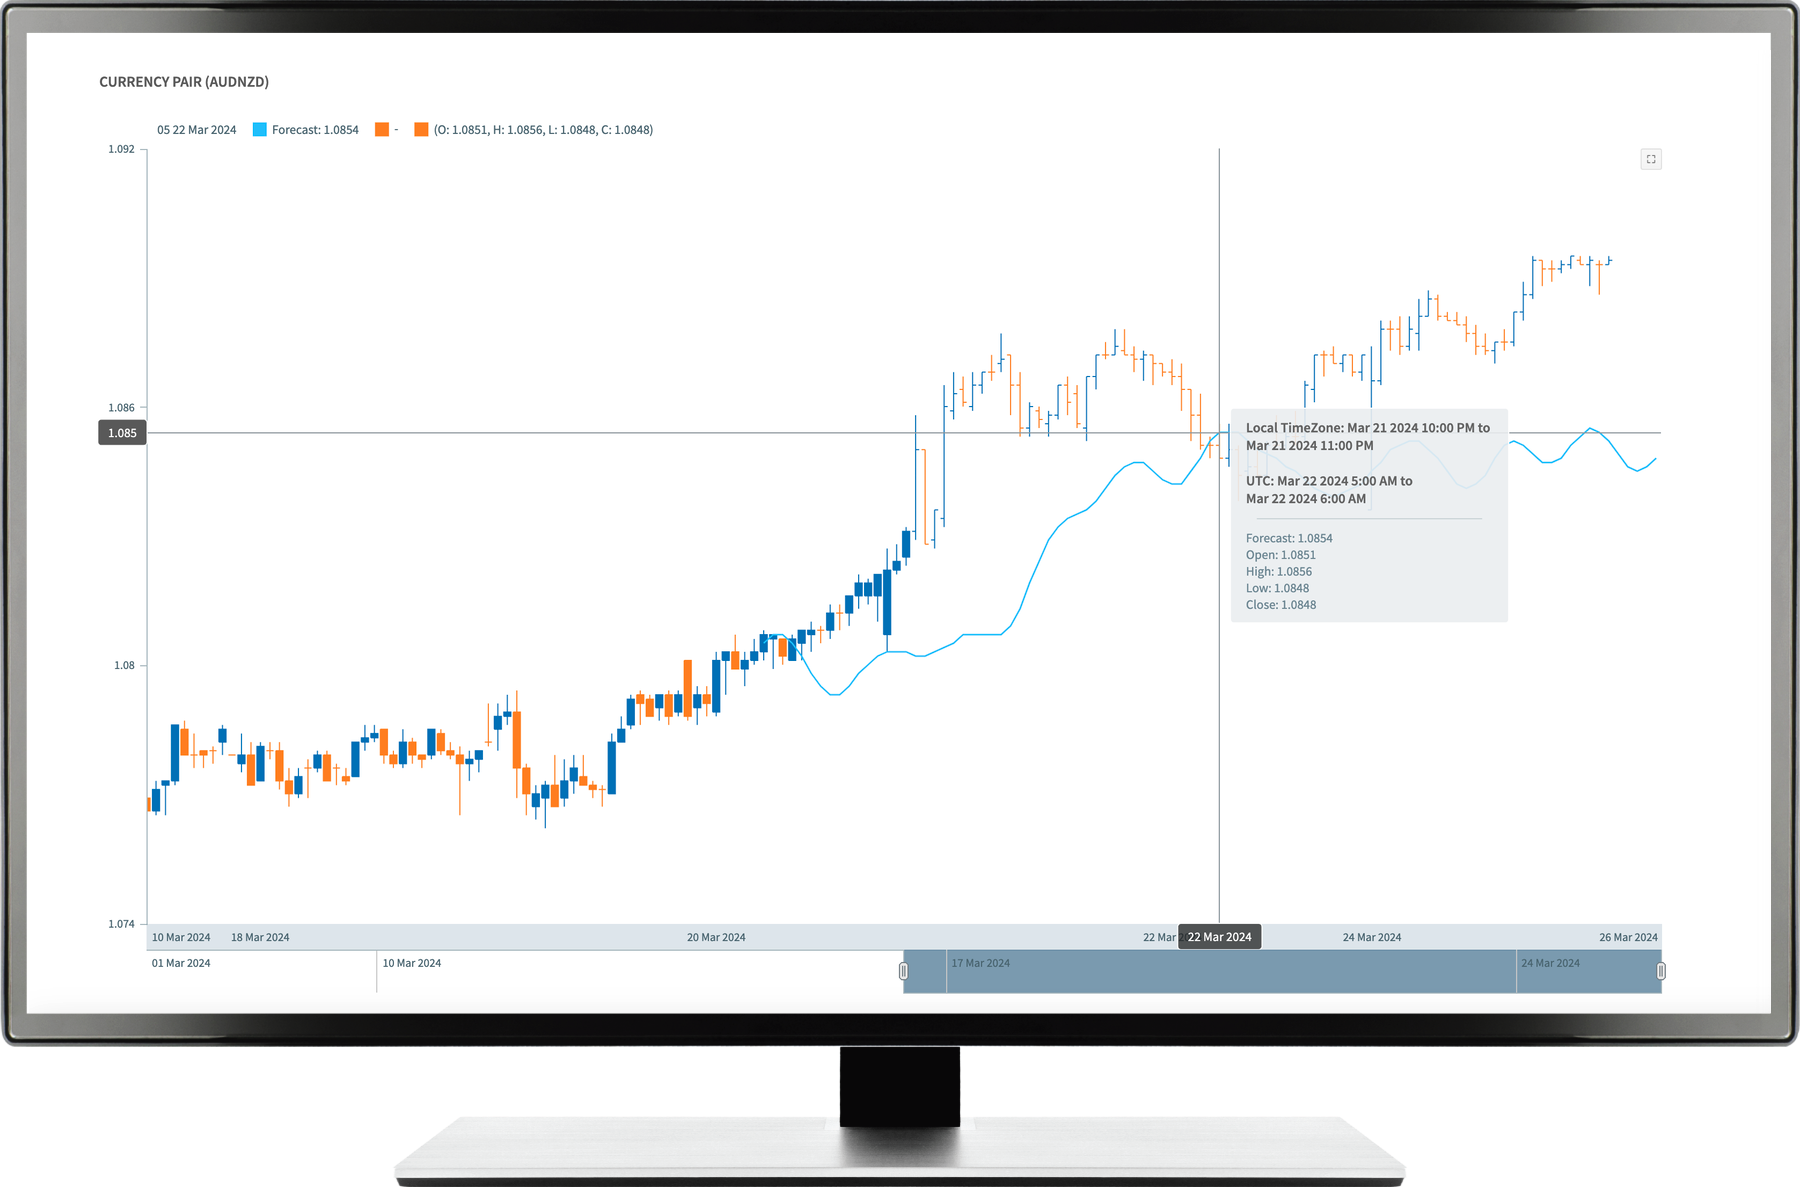
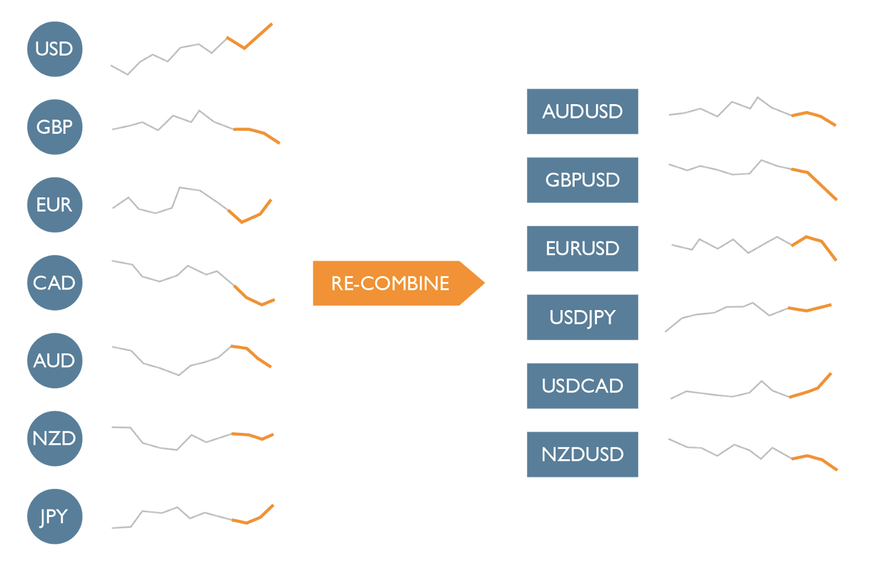
Rather than forecast separately on currency pairs, we apply the forecasting algorithm to the currency indexes alone. The TreelineFX currency indexes are designed to be interchangeable with the Forex market data. No data is lost when converting between the currency indexes and the source market data. As a result, we can recombine our index forecasts to create pair forecasts.
For example, we run a forecasting algorithm on each index EUR, GBP, USD, CAD, AUD, NZD and JPY. Each forecast gives us insight into how that currency is modeled. Then we can choose any pairs and combine these forecasts. The EURUSD forecast is calculated by recombining the EUR and USD forecasts. Likewise, GBPUSD forecast from GBP and USD forecasts.
If we create forecasts for EURUSD, GBPUSD and EURGBP, this strategy guarantees that the rules of the Forex game are maintained. The three forecasts won't contradict each other. If we forecast EURUSD long and we forecast GBPUSD short, we should expect our EURGBP forecast to be long. Running forecasts directly on the curreny pairs will almost certainly produce forecasts that contradict each other. How do you work with a forecast model that can't even follow the basic rules of the Forex market?
Hidden Support and Resistance
We're all familiar with the way support and resistance levels highlight potential areas of supply and demand. However currency pairs are more complex than regular stocks, and our currency indexes present an opportunity to find levels that are otherwise hidden. This is our most complex and speculative tool.
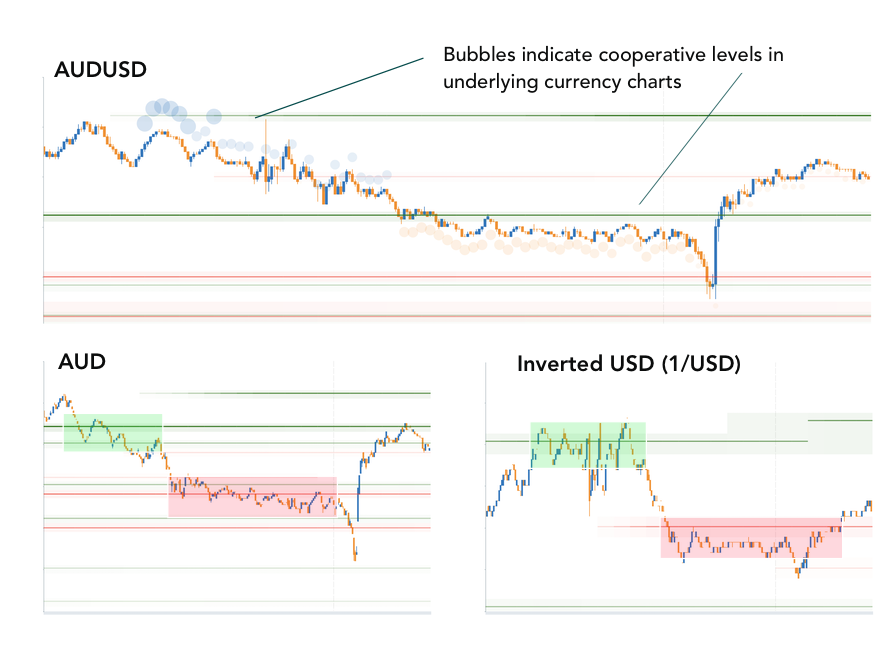
By calculating support and resistance lines on the underlying currency charts, we can detect potential areas that can assist in the timing of trades, and selection of which pair to trade. For example, for the pair GBPUSD, our charts draw level lines for the pair itself, as we're already familar with. Next, we draw support and resistance lines on the GBP and USD indexes. These are an interesting new tool for traders to expermiment with. Our tool presents these charts with the option to invert the second (quote) currency. This aligns the direction of GBP and USD for example to match that of the GBPUSD pair and is more intuitive to examine.
But we go one step further and coalesce these underlying currency chart levels. If the price of the GBP index approaches a support line for example, and the price of the USD level approaches a resistance line, we infer that the pair GBPUSD is entering a period of support interest. The pair itself may not even have support or resistance lines at this moment, owing to the complexity of Forex pairs. Our tool indicates this coincidence of underlying currency levels with colored bubble markers, sized to indicate the strength and relevance of the underling levels.We believe the hidden support and resistance areas have great relevance, and need to be interpreted using a wider context of the market with regard to concepts such as accumulation and distribution.
Clean Data for AI
AI and automated analysis systems need training data. Your model will be working overtime just to untangle the correlated currency pair data, let alone do it's actual job. Our currency indexes are information dense, decorrelated signals that capture the market movements.
Our API service is for the professional analyst who wants to bring new clarity to their data models, with up to the minute live data.

